Layout Hints and Tips.
How to make your reports and portfolios standout and be easy to read.
It can be hard to get everything you want to say on one or two pages. The goal here is to have the deep content and research but in a format that is easy and quick to digest. The dream scenario is that at a glance we should be able to instantly understand your message and then delve deeper into the content if we want to.
It’s very easy to just throw everything on a page and it to look like an overwhelming mess.
So some hints and tips on how to structure your page layout: A red minus sign means we’d like to see less of this, a green plus means try to be more like this.
90% of the information processed by the brain is visual.
Our brain processes images 60,000 times faster than text.
‘Show me’ don’t ‘tell me’. A [good] picture “paints a 1,000 words”
Lead with your images (photos, graphs, diagrams, sketches etc..) but don’t add ‘icons’ or clip art for the sake of it. A good image is worth it’s weight in gold, a naff ‘graphic’ that needs explanation and just takes up space is not just a waste of time and space but actually a handicap.

Lead with your images, if you ever find yourself writing a description, just show an image. If you are ever comparing to something else, will an image say it better? Often I read student reports and all the time I’m saying to myself “show me, show me, show me, why have they not shown me”.
Annotated, pictures are quick and easy to understand and a single picture can make multiple points (with annotations to draw my attention to that point). Whereas text takes much longer to digest and will only ever tell me the single thing that you’ve written about.
Grid Consistency:

No apparent structure to the content on the left and one organised to a consistent grid on the right. If you divide your page into thirds or quarters, make any content fit a divisible division of your grid. For example, the content on the right has been split in half, so all content should be either a whole, halves, quarters, eighths etc…
More ‘White Space’

These two text boxes are the same size and with the same content. The box at the bottom is a smaller font size for the body text but with larger line spacing so the amount of ‘white space’ around the content is larger. Despite being a smaller font it’s much easier to read with more room for a larger title which stands out more and is more easily seen.
Curved Corner Box Syndrome (CCBS)
Can I be a radical and question why every draft submission I see seems to put every piece of text in its own heavy bordered curved corner box? It’s often like MS word clipart… hideous ;-)

Why not try something crazy like not using a box at all or putting a faint background colour box (no border) instead? It might just look slightly less… naff? Only joking, but if you’re going to do it, do it carefully and thoughtfully.
Icons & Stars
Similar to the CCB outbreaks above, everyone seems to love sprinkling icons and stars everywhere, whether they make sense or not. Icons and stars are an infectious disease… once you use one, you have to use more, every sections must have a unique icon or a star rating. It’s a very slippery slope into a mess of nonsensical clipart.
Tread the icon path carefully. If it isn’t understandable immediately it’s a distraction. Better to have saved the space for something value adding than a time consuming vector flurry.
CAPITALS are slower
Have you ever noticed how road signs are not written in all capitals? It’s because studies have shown that they are easier to read and understand quickly if written in lower case letters. All caps is useful for attracting attention (DANGER signs are all caps for example) but not for communicating complicated information.

Titles should Spoil the Surprise
Don’t tease us with titles that hint something of interest may be in this section. Give us the answer straight up. I should be able to glance through at the titles and get a good sense of what is being covered and what was found.

Think about newspapers, they don’t start their articles with the title: “News from the United States” and then leave you to read it all before you understand what they are talking about.
No they say things like “Trump refuses to disavow QAnon conspiracy theory” or “Donald Trump’s non-payment of taxes exposed” etc… They give away the story straight away and if you want to know more then read on, otherwise move on to the bit that interests you. We want the same here.
Say More Than One Thing at a Time:
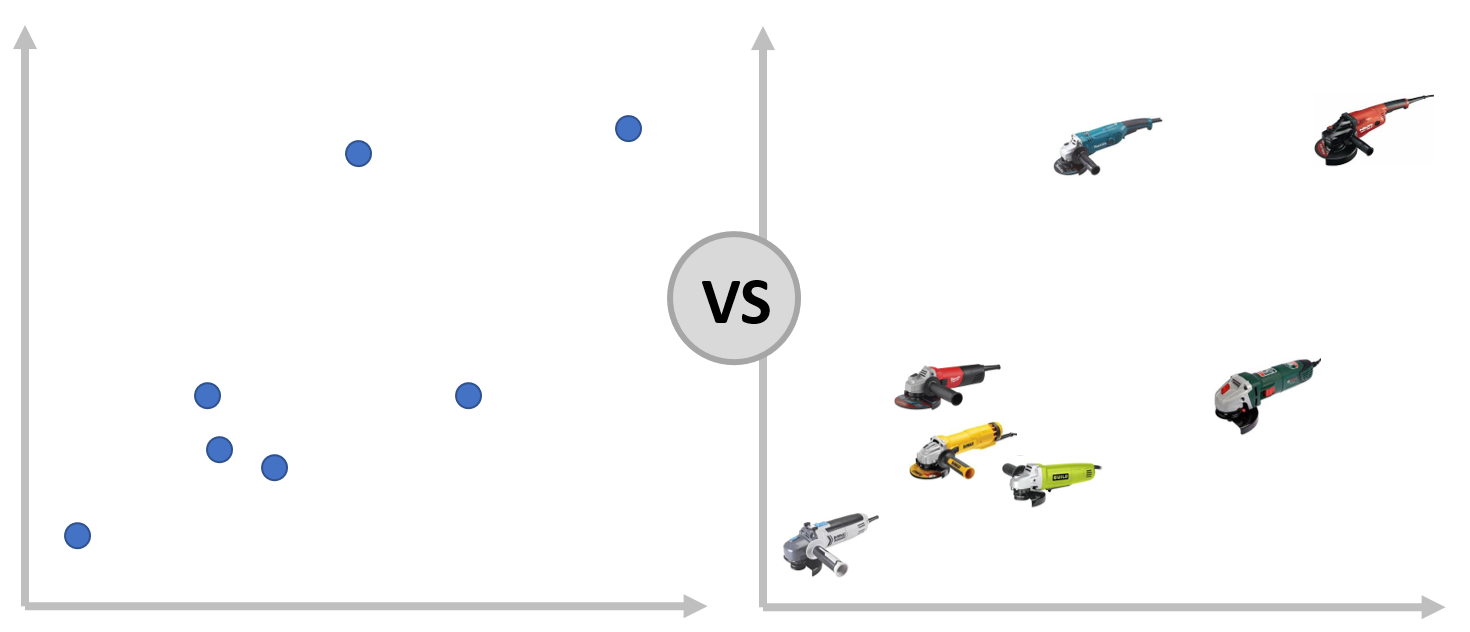
Graphs, Images and Infographics are an excellent way of getting information across quickly. Although sometimes the graphs require a small essay of text to help explain them. Try and say more than one thing at a time, using the product images instead of points, on the above example, removes the need to explain which point is which product and more more easily gives the context of what you’re talking about.
Colours!
Colours are great, but don’t go crazy with your colour scheme. Get help from some pros with websites like c

It’s easy to get carried away and before you know it you’ve got half a dozen effects and a dozen different colours. Keep it simple, keep it clean. Solid block colours are easier to read.

Columns Are Faster
If the aim of the presentation is speed of understanding and speed of reading. Then take some tips from the ‘pros’… There is a reason newspapers are arranged in narrow columns: they are faster to read. So avoid big long lines that go all the way across the page and instead chop them up into smaller columns that reflect your grid structure.

A box around everything makes everything equally insignificant
Everyone seems to love putting text or images in boxes. I’m not sure why, but its not a great idea for one simple reason. Adding a box around something highlights it, brings it to the reader’s attention. If there is a box around everything it’s no longer helpful for emphasising something and is now just an artistic distraction. Only highlight the most important bits.

Whenever I am infuriated, I revenge myself with a new diagram
Florence Nightingale

Worked Examples:
Some genuine draft examples and our quick suggestions for improving them. In all cases we did not make any changes to the words or research, just some quick visual tweaks to make them ‘cleaner’ and easier to understand / digest.

The exploded diagram was great, but it wasn’t immediately obvious where the information for each bit was, the colouring of the number blobs mismatched, yellow there and grey here. Also it required hunting around for the answer.
The systems diagram in the bottom left was oddly black and felt out of place and just squashed into whatever space was left.
The improved version tried to put each piece of relevant text next to each item, but this could have been done even better still as there’s lots of repetitive labelling now. The name of the product is made more prominent in the top left corner (where most people start reading). Subsections of the product are also now clearly labelled.

Slight case of CCBS here and the student was saying they didn’t have any more space… we removed all that and in doing so created a new space for some product improvements.
Also toned down the fade to white grey background. The long lines of text that stretch the whole width have been compressed into narrow columns to make them less tiring to read and most elements now align together either side of a central split.
Finally the insightful graph is no longer squashed so you can actually make sense of it.
Nothing removed but now all much clearer and with even more space for more content should they wish.

Another case of CCBS, removing those and adding a little colour to help distinguish between different sections quickly made it easier to understand and less cluttered. The font was made a size smaller to add more white space and everything was organised and aligned into 2 columns.

The work was good but hard to understand and digest quickly. As a reader we could not pick things out quickly at a glance. The product improvement suggestions (a part of the mark scheme) for example were completely lost in the cluttered text and easily missed. It also wasn’t obvious which part of the page belonged to which.
Continuing their bold colour scheme we added some variety to break up the page and give it structure.